From spreadsheet to strategy: why most trading journals fail
You have been tracking your trades for months now, maybe longer, and you open up that spreadsheet again hoping to find some insight that explains why your account balance has not moved the way you expected it to, and what stares back at you is a wall of numbers that tells you almost nothing useful beyond the fact that you made some money and some losses and the two somehow did not add up to progress the way you had imagined they would when you first started this journey
This is the quiet frustration that sits at the center of most retail trading journals, and it is the reason so many traders spend years repeating the same mistakes without ever understanding why those mistakes keep happening in the first place
The spreadsheet became the default solution because it was available, because it felt structured, because numbers feel like rigor even when they are not actually measuring anything meaningful
You create columns for entry price, exit price, position size, and maybe a calculated p&l column that tells you whether you are up or down on any given trade, and then you save it and you move on to the next chart and the next setup and you tell yourself that the data will reveal patterns eventually if you just keep collecting it long enough
The problem is that raw data without context is just noise, and noise does not teach you anything no matter how long you stare at it or how many trades you add to the pile
The problem with tracking what happened instead of why it happened
A spreadsheet captures the mechanics of a trade with perfect accuracy and zero insight
Entry at 1.1056, exit at 1.1089, long eur/usd, plus 33 pips, fine
But that number tells you nothing about the thirty minutes before the entry when you second-guessed yourself and almost skipped the setup entirely, nothing about the moment you moved your stop to breakeven too early because you got nervous, nothing about the external news event that was about to drop and you chose to fade it anyway because you were feeling confident
The actual story of that trade, the parts that determined whether it was a good decision or a lucky one, lives entirely outside the spreadsheet because spreadsheets have no way to capture decision quality versus outcome quality and these two things are not the same and they are never the same no matter how much you want them to be
This is where most traders get stuck in a loop that feels like learning but is not actually learning at all
You review your spreadsheet, you notice you lost money on three consecutive short trades last week, and you conclude that shorting does not work for you when the real issue might be that all three of those trades happened during a window when market structure was compressing and the odds of a breakout continuation were significantly elevated and that had nothing to do with your directional bias and everything to do with the specific conditions you chose to trade in
Without the ability to tag and filter by the context surrounding each trade, you are left guessing at causation from correlation and guessing is not analysis and it never will be no matter how sophisticated your spreadsheet formulas become
Tagging mistakes is where the real learning lives
Every trade is a data point but not every data point contains useful information, and the information that matters most is usually buried in the metadata that most journals never capture
What was your emotional state when you entered, were you following a confirmed setup or acting on a hunch, did you honor your rules or did you deviate and if you deviated why did you deviated and what were you hoping would happen that did not, these questions are where growth actually happens but they are questions that most tracking tools are structurally incapable of answering because they treat all entries and exits as equally meaningful when they are not
Tagging a trade as revenge trading after a loss, or as a revenge trade immediately following a winning trade, or as a trade where you moved your stop under pressure, these labels transform a number into a lesson and a lesson into something you can actually study and improve upon
Over time you start to see patterns in your own behavior that are far more predictive of your results than any indicator combination you could dream up, patterns like the fact that your win rate drops by fifteen percent when you are trading with less than four hours of sleep or the fact that your average loss size balloons whenever you take a trade immediately after checking your p&l mid-session rather than waiting until close
Spreadsheets can technically accommodate tagging if you are disciplined about it, but the workflow is so cumbersome that almost nobody does it consistently, and inconsistency in journaling is worse than not journaling at all because it gives you a false sense of security that you are tracking your performance when you are really just collecting incomplete data that you will misinterpret later
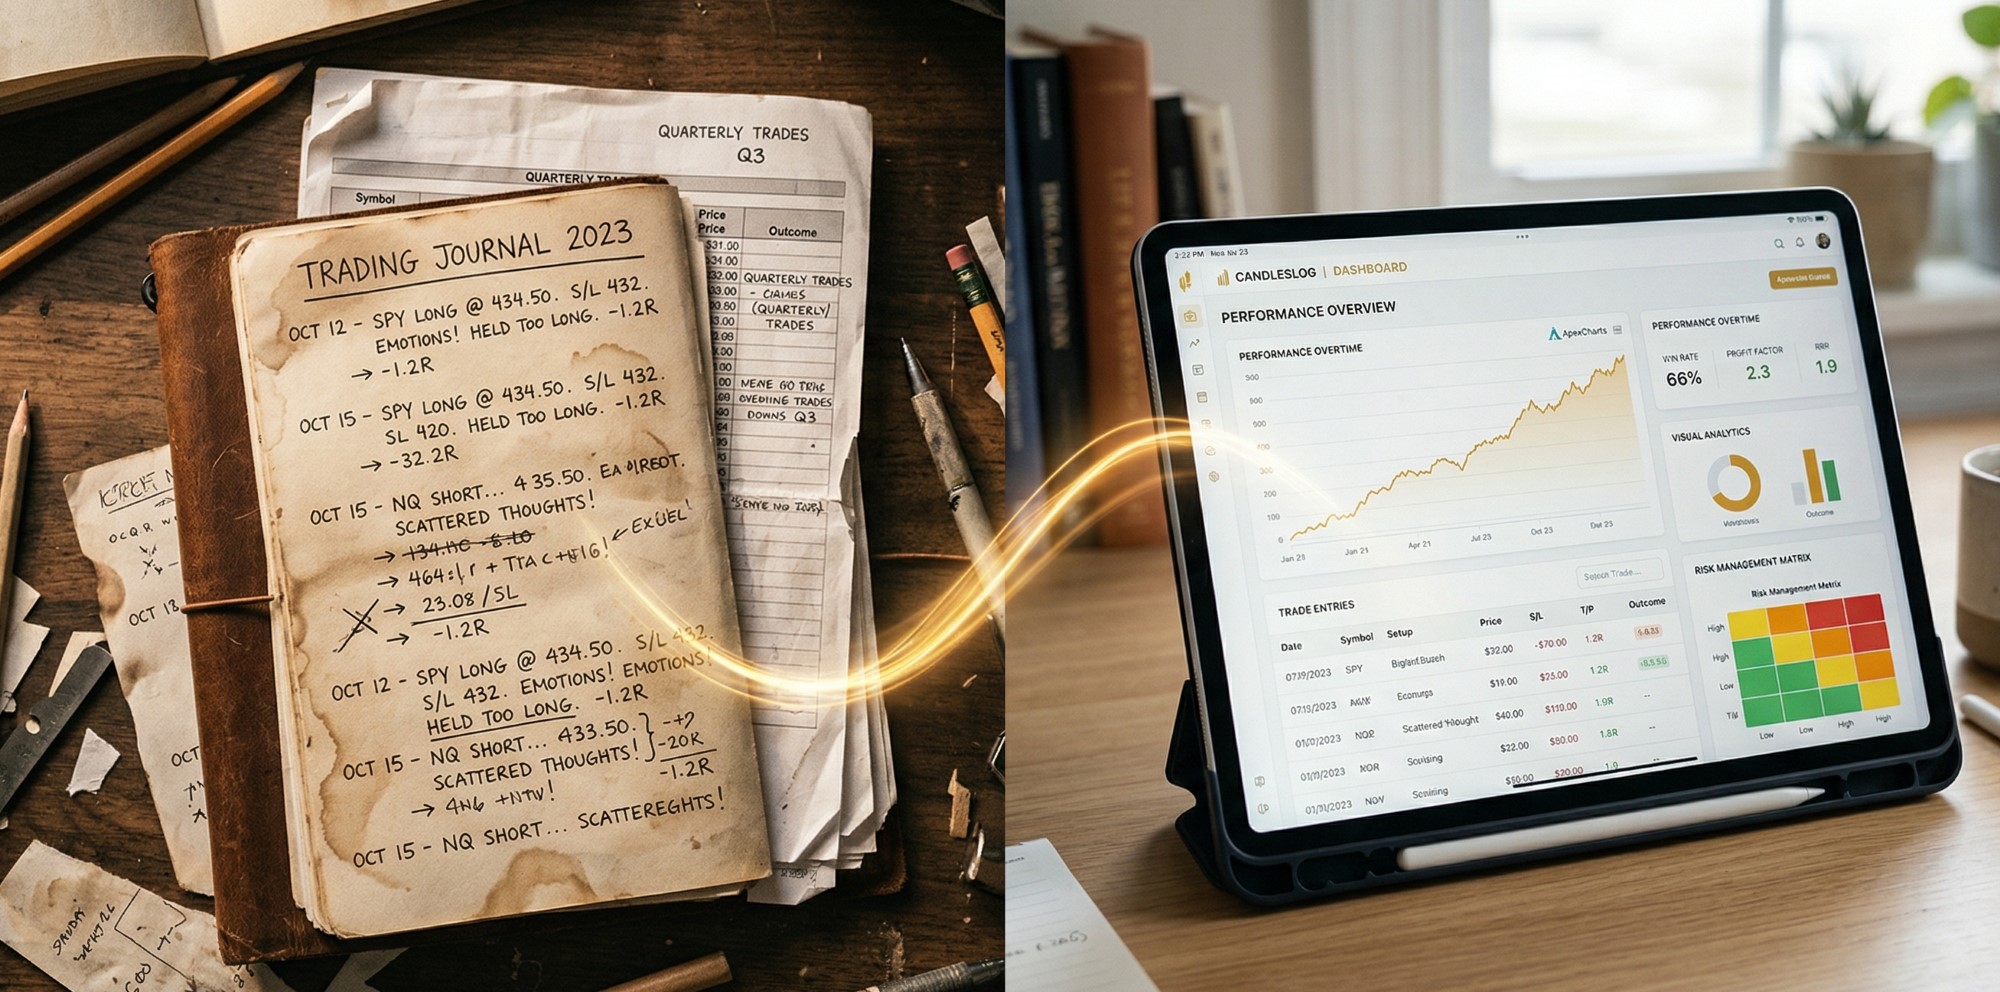
Mood and energy tracking provides the context that transforms raw numbers into actionable insights, and CandlesLog was built around this reality because it is the reality that matters most when you are trying to build a sustainable edge rather than just hoping that more trades will somehow magically produce better results
Strategy-specific tagging lets you run a clean comparison between approaches, lets you see clearly which setups are earning their keep and which ones are just adding noise to your performance record, and this clarity is what transforms journaling from a record-keeping exercise into a strategic tool that actually changes your decision-making over time
Strategy-specific analysis separates professionals from amateurs
A trader who runs multiple strategies has an immediate advantage over someone who trades intuitively across different setups, but only if they have the analytical infrastructure to separate the performance of each strategy rather than blending everything into one aggregate number that tells you almost nothing useful
When your spreadsheet shows a thirty percent win rate across all trades, is that because your momentum strategy is performing exactly as designed while your mean reversion approach is bleeding money, or is it the other way around, or are they both underperforming in different ways that happen to cancel each other out numerically
Without strategy-specific tracking you cannot answer these questions honestly, and trading requires honest answers more than it requires positive narratives
You need to know which edge you are actually trading and whether that edge is still present in current market conditions or whether it has degraded to the point where you are just fooling yourself about your expectancy
Measuring your actual trading edge with profit factor becomes possible only when you can isolate each strategy and evaluate its performance independently
CandlesLog was designed from the ground up to track strategy performance with visual analytics powered by ApexCharts so you can see which setups are working and which ones need to be reconsidered
Time-of-day patterns reveal hidden drag on performance
Market conditions shift across the trading session in ways that interact powerfully with your own cognitive and emotional state, and this interaction creates patterns that most traders never see because their journal has no time-of-day awareness to speak of
The first hour of the major session often brings sharp liquidity and volatility that rewards fast decision-making and punishes hesitation, the middle of the session can flatten into range-bound noise that drains accounts slowly for traders who keep searching for setups that do not exist in sideways markets, and the close often brings afternoon volatility that reverses the morning trend more often than beginners expect
If your journal shows that you are profitable between eight and ten am but consistently lose money between two and four pm, that is not random variation that is information, and that information tells you exactly when you should be active and when you should step away and protect your capital by closing your platform and going for a walk
The spreadsheet cannot show you this because a spreadsheet does not know what time you traded or how that time relates to the session structure of whatever market you are trading, it just knows that trade seven happened after trade six in the chronological sense but that is not the same as knowing that trade seven happened during your worst performing window of the day on a consistent basis
CandlesLog captures session context automatically because this context is too important to rely on traders manually entering it, and the difference between knowing your patterns and not knowing them is the difference between systematic improvement and years of expensive trial and error
What you are actually missing when you settle for basic tracking
The gap between a spreadsheet and a proper trading journal is not a gap in features, it is a gap in thinking about what trading actually is and what kind of data leads to actual improvement versus the illusion of improvement
Trading is a decision-making activity that happens in conditions of uncertainty, and decision quality cannot be captured by entry and exit prices alone, it requires capturing the process and the context and the mental state and the rule adherence that surrounded each decision
Basic tracking tells you what happened after the fact, which is useful for record-keeping but not for learning, and learning is the only edge that compounds over time in a way that actually matters for your long-term results
Without tagging for mistake types you will keep making the same mistakes without knowing it, without strategy-specific analysis you will never know which approach is actually working for you, without time-of-day awareness you will keep fighting your worst periods instead of eliminating them, and without emotional state tracking you will never understand why you can be profitable for weeks and then give it all back in a single emotional session
Trading psychology and emotional patterns explain why disciplined traders sometimes underperform and undisciplined traders sometimes get lucky, and understanding this connection is essential for anyone serious about building a real edge
CandlesLog was designed from the ground up to close each of these gaps because closing them is not optional if you are serious about building a real edge rather than just accumulating experience without expertise
Make the shift before another month disappears
Your next hundred trades will teach you something if you let them, but they will only teach you what you designed them to teach you, and a basic spreadsheet was not designed to teach you anything it was designed to store numbers
The traders who improve fastest are the ones who treat their journal as a strategic asset rather than a bookkeeping task, and the first step in doing that is moving to a tool that captures the data that actually drives decision quality
If you have been running on spreadsheets and notes because it was the easiest option available, now is the moment to make the upgrade that your development as a trader has been waiting for
CandlesLog is built to capture the context, the patterns, and the insights that basic tracking simply cannot provide, and the traders who make this shift tend to look back at their spreadsheet days as the period when they were working hard but not actually learning much at all
The transition takes less than an hour, your historical data can be imported rather than rebuilt, and the insights you gain from proper journaling will change how you think about every trade you take from here forward
Do not let another hundred trades pass without understanding them
Start your journey at candleslog.app where you can import your existing trade history and begin tracking with context, strategy, and emotional awareness that your spreadsheet never captured
Frequently Asked Questions
Why do most trading journals fail?
Most trading journals fail because they track what happened rather than why it happened. A spreadsheet captures entry price, exit price, and P&L but provides zero context about decision quality, emotional state, rule adherence, or market conditions. Without this context, traders cannot identify why they make the same mistakes repeatedly or which strategies actually contribute to their performance.
How do you tag trades effectively in a trading journal?
Effective trade tagging requires capturing multiple dimensions beyond entry and exit. Tag your emotional state before the trade, whether you followed your playbook or deviated, the specific setup or strategy that generated the signal, and any external factors that influenced your decision. CandlesLog automates much of this tagging so it takes seconds rather than minutes, making consistent journaling actually sustainable.
What is the difference between tracking and journaling?
Tracking records what happened: entry, exit, P&L. Journaling captures why it happened: the analysis before entry, the emotional state, the rule adherence, the market context. Effective trading journals combine both, transforming raw numbers into lessons that compound your learning over time rather than just storing data you will never review meaningfully.
How do I import CSV trades into CandlesLog?
CandlesLog supports CSV imports from most major brokers and trading platforms. Navigate to the Import section, upload your CSV file, map the columns to CandlesLog fields, and your historical trades will be available immediately with full analysis capabilities. The import preserves all trade data including timestamps, prices, and quantities.
Can I track multiple strategies separately in CandlesLog?
Yes, CandlesLog supports strategy-specific tagging that lets you isolate and compare the performance of different approaches. Tag each trade with its associated strategy, then view analytics broken down by strategy to see which setups are earning their keep and which might need to be reconsidered or eliminated from your approach.
Ready to Put This Into Practice?
CandlesLog is free. Start your trading journal today and apply what you've learned.
Start Free Journal